import matplotlib.pyplot as plt
import numpy as np
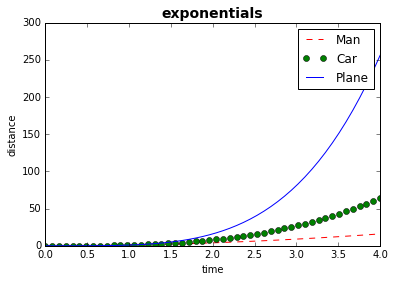
Plot
%matplotlib inline
xs = np.linspace(0,4)
plt.plot(xs, xs**2, 'r--', label='Man')
plt.plot(xs, xs**3, 'go', label='Car')
plt.plot(xs, xs**4, 'b', label='Plane')
plt.legend()
ax = plt.gca()
ax.set_title("exponentials", size=14, weight='bold')
ax.set_xlabel("time")
ax.set_ylabel("distance")
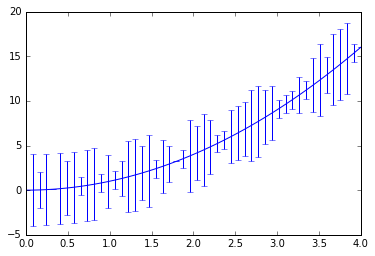
Error bars
yerr = np.random.random_integers(-4,4,xs.shape)
plt.errorbar(xs, xs**2, yerr=yerr)
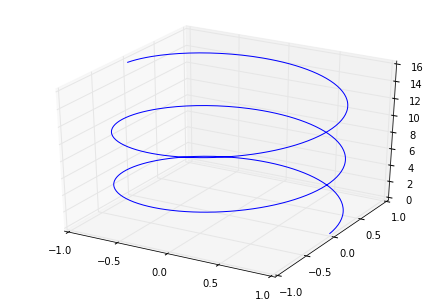
3D Plots
from mpl_toolkits.mplot3d import Axes3D
fig = plt.figure()
ax = Axes3D(fig)
t = np.linspace(0, 5*np.pi, 501)
ax.plot(np.cos(t), np.sin(t), t)
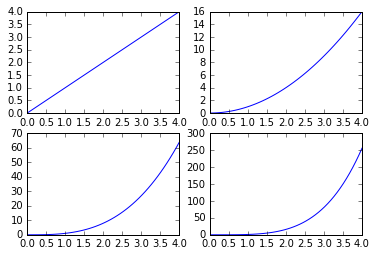
Subplots
plt.subplot(2,2,1)
plt.plot(xs, xs)
plt.subplot(2,2,2)
plt.plot(xs, xs**2)
plt.subplot(2,2,3)
plt.plot(xs, xs**3)
plt.subplot(2,2,4)
plt.plot(xs, xs**4)